Online · Free
Data Science and Analytics Internship
8 short weeks. Free. Start any date.
By Wartens Ltd (UK), delivered through EDWartens.
- Free
- Online
- Any start date
- 1 to 8 weeks
Who it suits
Made for beginners.
- Students of commerce, management, statistics, computer science and engineering.
- Anyone who wants to turn a messy table into a clear answer and a simple dashboard.
- Read the notes on a phone, a tablet or a laptop.
What you will learn
Eight weeks, one picture each
Week 1
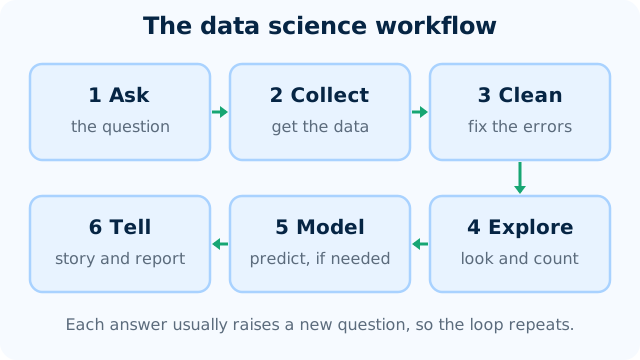
The data science workflow and the questions data answers
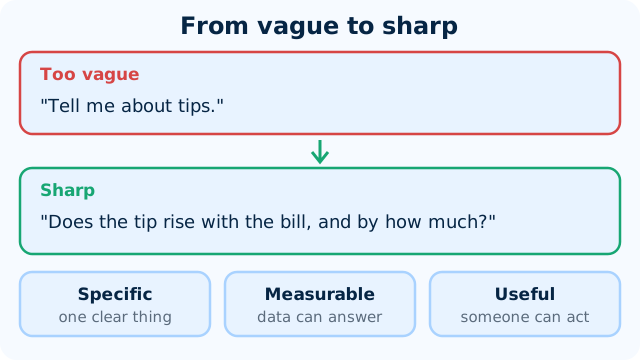
Turn a vague worry into a sharp question, name the six steps of a data project and say what a tidy table looks like.
Week 2
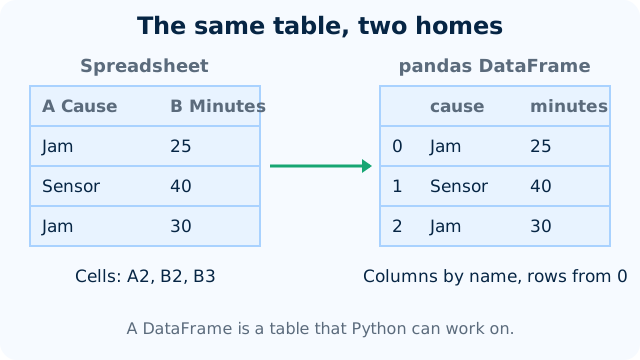
Spreadsheets to Python (Colab, pandas)
Run a notebook in Google Colab, load a table into a pandas DataFrame and repeat your spreadsheet sums, sorts and filters in code.
Week 3
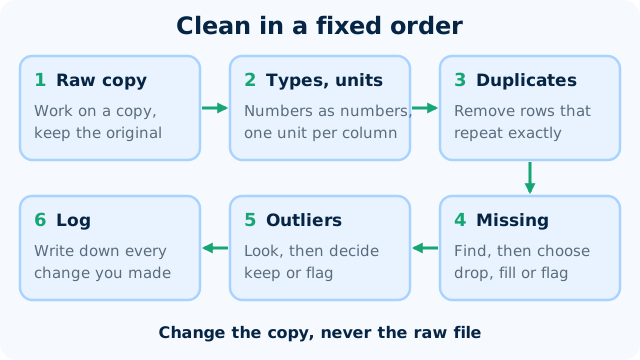
Cleaning and preparing data
Find missing values, duplicates, wrong units and outliers in a table, fix them in a fixed order and keep a log of every change.
Week 4
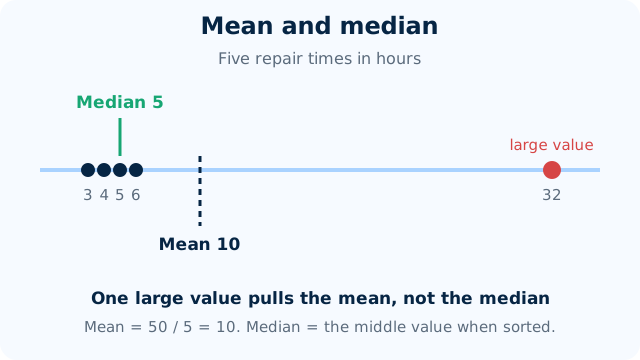
Exploratory analysis and statistics
Summarise a column with the mean, median and standard deviation, compare groups with a group-by, and say what a number does and does not tell you.
Week 5
SQL for analysis
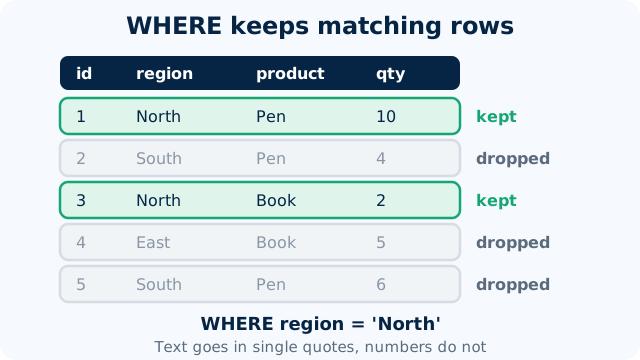
Write SELECT queries that filter with WHERE, sort, calculate, and summarise with GROUP BY, and say what each result should look like before you run it.
Week 6
Visualising data and dashboards
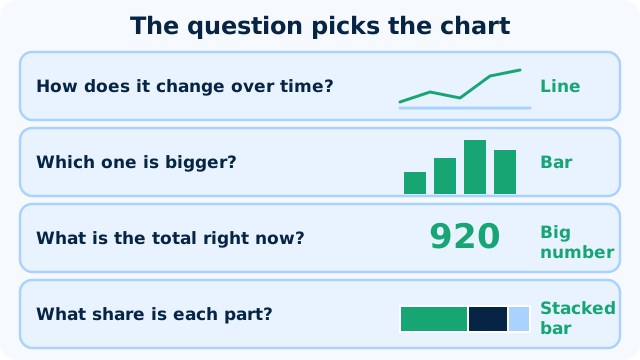
Choose a chart from the question being asked, avoid charts that mislead, and build a clear three-chart dashboard in Looker Studio or Google Sheets.
Week 7
From analysis to prediction (a first model)
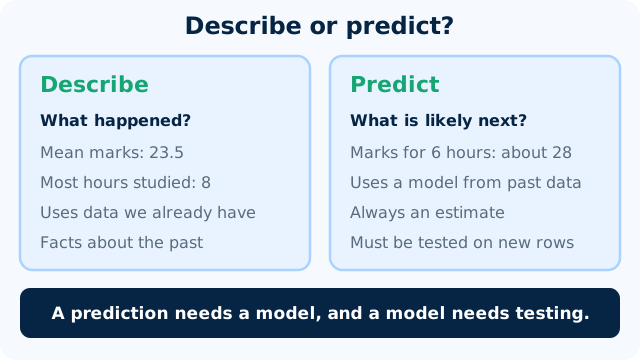
Fit a first linear regression, read its slope and R squared, and say honestly what the model can and cannot tell you.
Week 8
Telling the story and the analysis report (mini project)
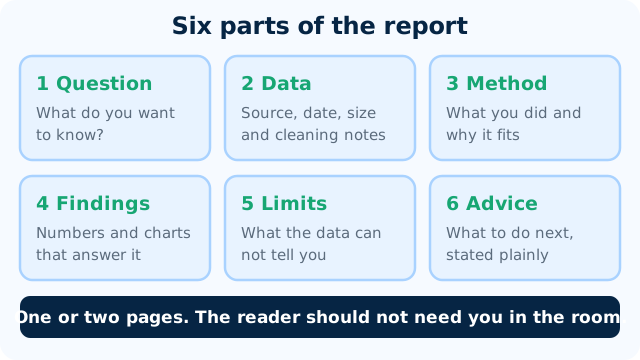
Turn an analysis into a short report with a question, data, method, findings, limits and a clear recommendation.
Practice, if you like
Analyse a real table, then check your answer.
- Free tools: Google Colab, Google Sheets, Looker Studio and Power BI Desktop (free, Windows).
- Small datasets that load quickly.
- A mini project in week 8: an analysis report with a clear story.
- Best on a laptop or tablet. A phone works for reading.
Your pace
Choose a start date and a length.
Any length from 1 to 8 weeks. Start on any date from today. Retry the weekly checks and the final quiz as often as you like.
Certificate and documents
Want proof? Add it later.
Questions
Quick answers
Is the Data Science and Analytics Internship really free?
Yes. Joining is free and so are all eight weeks, the weekly checks and the final quiz. You pay only if you choose an optional add-on.
How long can I take?
This internship runs for 1 to 8 weeks. You pick a start date and can change your plan later. All eight weeks are open from day one, so a short plan moves fast and a long one gives you room.
What do I need?
A laptop or tablet, a free Google account for Colab, Sheets and Looker Studio, and a free AI assistant to explain what you do not follow. Every tool used is free or has a free tier, so there is nothing to buy. The notes also read well on a phone.
What will I actually do?
You read short notes with diagrams, watch a few videos and take an easy check each week. Each week ends with a worked exercise, such as cleaning a column, grouping with pandas, writing a SQL query or building a chart. Week 8 ends with a short analysis report for a reader who is not a data person.
What do I get at the end?
A certificate of completion is an optional paid document, issued by Wartens Ltd (UK). It has a QR code and a number, so anyone can verify it at edwartens.com/verification. The lessons stay free, and you can finish without buying anything.
Is this a paid position?
No. It is training, not employment. Nothing is paid to you, and nothing here promises work with any company.
Who wrote the course?
OFORO, the Wartens AI company, wrote the notes and exercises. OFORO builds the AI behind Wartens' engineering and training work. The internship is run by Wartens Ltd (UK) and delivered through EDWartens.
What about privacy and wrong answers?
Data work often touches people's details, so the course teaches you to remove or mask them first and to use practice data only. AI can write plausible but wrong code and wrong conclusions, so you check every result against the data. Never paste personal, client or confidential data into a public chatbot.
Your first lesson is free.
- No card to start
- Start any date
- Verify with a QR code