Engineering data · Free
Excel for Engineers: Formulas, Data and Dashboards
Excel for engineers and technicians: clean Tables of readings, references and core formulas, IF and tolerance checks, XLOOKUP and INDEX-MATCH, cleaning text and timestamps, PivotTables, scatter charts with trendlines and control-style charts, Power Query imports of CSV and PLC or SCADA logs, conditional formatting and validation, dynamic arrays, dashboards and macros, finished with a shift-report workbook.

Inside the course


From the lessons

The Excel workspace, clean data entry and Tables
Kevin Stratvert

IF, logic and conditional counts
Kevin Stratvert
Cleaning text, dates and times
Leila Gharani
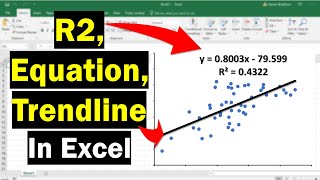
Charts for engineering data
Steven Bradburn

Conditional formatting and data validation
Kevin Stratvert

Building an engineering dashboard
Kevin Stratvert
Lesson frames belong to the creators named in the Credits below and are shown from YouTube.
What you will learn
Set up engineering data as Excel Tables; write formulas with the right references and rounding; flag readings against tolerances with IF and conditional counts; look values up with XLOOKUP and INDEX-MATCH; clean tag names and text timestamps and calculate durations across midnight; summarise downtime with PivotTables; plot calibration data on a scatter chart with a trendline and build a control-style chart; import and combine CSV and PLC or SCADA log files with Power Query; protect entry sheets with validation and highlight out-of-limit values; use FILTER, UNIQUE, LET and LAMBDA; build a one-screen dashboard; record a simple macro; and assemble a shift-report workbook that refreshes from new data.
- Lay out readings, tags and logs as tidy Excel Tables with named limits
- Write formulas with relative, absolute and mixed references, ROUND and unit conversions
- Check measurements against tolerances with IF and count them with COUNTIFS and SUMIFS
- Look up tag and equipment data with XLOOKUP and INDEX-MATCH
- Clean tag paths and text timestamps, and calculate durations across midnight
- Find the biggest downtime losses with PivotTables and a Pareto
- Plot calibration data with a trendline and build control-style charts with proper limits
- Import and combine CSV and PLC or SCADA logs with Power Query, then build a dashboard and a one-click shift report
For you
Taking Excel for Engineers: Formulas, Data and Dashboards from the United States
- Free in the United States, as everywhere, and self-paced: lessons, notes and the final assessment are open at any hour, so your time zone and shift pattern do not matter.
- The optional certificate for learners in the United States is a one-off US$23.99. What you get for it
- Plants across the Americas most often run Allen-Bradley, Siemens and Inductive Automation; each has its own free course to take next.
- See automation and engineering jobs in the United States, and what the industry looks like in Houston, Detroit and Chicago.
- EDWartens also has a regional site for the United States, for classroom training and local support: edwartens.com/us.
The course project · about 10 hours
A shift-report workbook for a packaging line: SCADA log import, downtime analysis, dashboard and one-click report
Build the workbook a production engineer uses every morning: it imports a folder of daily SCADA exports with Power Query, cleans timestamps and tags, calculates downtime, stops, MTBF, MTTR and temperature excursions, shows them on a one-screen dashboard with slicers, and refreshes and exports the report with one button. The sample pack shows each document for Line 2 of a packaging plant near Bristol.
Sample document pack, 6 documents, filled in for the scenario
- PlanWorkbook specification: Line 2 shift report
- Tag listTag list and data dictionary: Line 2 daily SCADA export
- RegisterCalculation register: KPI formulas and hand checks for 30 Sept 2026
- Test reportWorkbook verification record before first use
- ProcedureDaily procedure: producing the Line 2 shift report
- ReportShift report: Line 2, 30 Sept 2026
Read inside the course and download as a workbook. The project is optional practice, marked when you submit it; the certificate needs only the modules and the final assessment.
Course content
13 modules · 39 lessons · 8h 47m
In order, at whatever pace suits you. Each module ends with a practice task that builds on the last.
- 01The Excel workspace, clean data entry and Tables3 lessons27m
- 02Cell references and core formulas3 lessons43m
- 03IF, logic and conditional counts3 lessons1h 8m
- 04Lookups: XLOOKUP and INDEX-MATCH4 lessons45m
- 05Cleaning text, dates and times4 lessons1h 16m
- 06PivotTables for plant data3 lessons41m
- 07Charts for engineering data4 lessons30m
- 08Power Query: importing CSV files and PLC or SCADA logs3 lessons32m
Requirements
- Who it is for
- Beginner to intermediate. For engineers, technicians, students and job seekers. You need to be able to use a computer and do basic arithmetic; no Excel experience is assumed, and experienced users can move quickly through the first modules.
- Software
- Microsoft Excel for Windows or Mac from Microsoft 365, or Excel 2021 or 2024. Excel for the web (free with a Microsoft account) covers most modules. Dynamic arrays need Microsoft 365, Excel 2021 or later; LAMBDA and TEXTSPLIT need Microsoft 365 or Excel 2024; Power Query folder imports and macros need the desktop app. Copilot is not needed for any part of the course. What to download, and how
- Hardware
- A Windows or Mac computer. A second monitor helps but is not needed.
Software you need
What to download, where from, what it costs and how to install it. Every link goes to the maker's own site, never a mirror.
Excel for the web is free and covers most modules. Power Query folder imports and the macro module need the desktop app (Microsoft 365, or Excel 2021 or 2024); TEXTSPLIT and LAMBDA need Microsoft 365 or Excel 2024. Copilot is not needed.
Required
- 01Free web version with limits
Microsoft Excel
Microsoft
- Runs on
- Excel for the web in any modern browser; desktop apps for Windows and macOS with a Microsoft 365 subscription
- Account
- A free Microsoft account
Excel for the web is free with a Microsoft account and 5 GB of cloud storage. The desktop app comes with a paid Microsoft 365 subscription, which offers a free trial. Python in Excel is not available on free licences, and fuller Copilot features need an eligible paid plan.
Steps
- 1.Open the Excel page on microsoft.com and select Sign up for free, or Sign in.
- 2.Create or sign in to your Microsoft account.
- 3.Select Open Excel to start Excel for the web.
- 4.Upload the course workbook to OneDrive and open it.
- 5.If a lesson needs a desktop-only feature, consider the Microsoft 365 free trial.
- Most formulas, tables and charts work in Excel for the web; some advanced tools, such as Power Pivot and many add-ins, need the desktop app.
- Check the Python in Excel availability page before a Python lesson.
Official download pagemicrosoft.comAlternatives
- LibreOffice Calc: Free desktop spreadsheet for Windows, macOS and Linux.
- Google Sheets: Free browser spreadsheet with a Google Account.
Checked against each maker's own page on 27 September 2026. Trial lengths and editions change; the maker's page is the final word.
Excel for Engineers: Formulas, Data and Dashboards at a glance
Excel for Engineers: Formulas, Data and Dashboards is a free, self-paced online course from EDWartens for engineers, technicians and job seekers who work with readings, logs and plant data. It has 13 modules and 8h 47m of video lessons by Kevin Stratvert, Leila Gharani, excelisfun and others, with written notes and worked problems, a practical project with a document pack and a 15-question final assessment (pass mark 60%). Learning is free with an account; an optional certificate with a public verification code is issued when you pass. Last updated 27 September 2026.
All course factsHide course facts
- Price
- Free, for good. No trial, no card. The only paid item is the optional certificate, a small one-off fee.
- Who it is for
- Engineers, technicians and job seekers who work with readings, logs and plant data
- Format
- 13 self-paced modules, 8h 47m of video, written notes, a practice task per module and one final assessment.
- Level
- Beginner. Beginner to intermediate. For engineers, technicians, students and job seekers. You need to be able to use a computer and do basic arithmetic; no Excel experience is assumed, and experienced users can move quickly through the first modules.
- Brand
- Vendor-neutral
- Software
- Microsoft Excel for Windows or Mac from Microsoft 365, or Excel 2021 or 2024. Excel for the web (free with a Microsoft account) covers most modules. Dynamic arrays need Microsoft 365, Excel 2021 or later; LAMBDA and TEXTSPLIT need Microsoft 365 or Excel 2024; Power Query folder imports and macros need the desktop app. Copilot is not needed for any part of the course.
- Hardware
- A Windows or Mac computer. A second monitor helps but is not needed.
- Certificate
- Optional EDWartens Certificate of Completion, verifiable by code. Not a vendor credential.
- Video lessons by
- Kevin Stratvert, Leila Gharani, excelisfun, Chandoo, MyOnlineTrainingHub, EngineerExcel (independent creators, credited below)
- Language
- English
- Last updated
- 27 September 2026
A shareable EDWartens certificate
Finish every module and pass the final assessment, and the optional EDWartens certificate is yours. It carries a unique verification code on a public page anyone can check, so it stands up when a recruiter looks it up. See it below.
The course itself stays free whether or not you ever buy one.
Stuck? Ask a practising engineer
A free course usually means a comment section and hope. This one does not. Every module has an Ask-your-trainer panel that reaches the same engineers who teach our paid programme: people who commission panels for a living, not moderators.
Pairs well with
 PLC programming · FreeSiemens TIA PortalFrom zero electrical knowledge to a working, simulated S7-1200 program, for nothing.
 PLC programming · FreeSiemens TIA Portal in Three HoursThe first three hours of the Siemens TIA Portal course, cut to end on a win: what a PLC is, how it is wired, a project configured in TIA Portal, and your first ladder program running in simulation. Finish it in an evening or two, earn a certificate, and carry straight on into the full course.
 PLC programming · FreeTIA Portal: Build a MachineOne machine, start to finish. Take a bottle filling line from a written specification and an I/O list to a structured S7-1200 program with a fill station, a capper, a reject sorter and an operator screen with alarms, then test it against a written record and archive it for hand-over. The lessons are the reference; the machine is yours, and it is what you submit.
 Instrumentation · FreeInstrumentation for PLC EngineersThe half of the loop that is not code. Follow one measurement from the transmitter in the field, down the 4-20 mA loop, into the analog card, through NORM_X and SCALE_X into engineering units, out again to a valve, and back to the control room when the reading is wrong.
More free courses: Free Industry 4.0 and IIoT courses
Learner reviews
No reviews yet
Reviews here are written only by learners who have finished every module of Excel for Engineers: Formulas, Data and Dashboards, and they are published exactly as written. Finish the course and yours will be the first.
Common questions
Who is the Excel for Engineers: Formulas, Data and Dashboards course for?
Engineers, technicians, engineering students and job seekers who work with readings, test results, downtime logs or exports from PLC and SCADA systems. No Excel experience is assumed.
How is this different from a general Excel course?
The lessons come from well-known Excel teachers, but every worked problem, practice task and question uses engineering data: tolerances, calibration points, tag paths, shift logs, downtime reasons and CSV exports from control systems. There are no invoices or sales figures.
Do I need Microsoft 365 or Copilot?
No. Excel for the web is free with a Microsoft account and covers most modules; Excel 2021 or 2024 covers almost everything. Power Query folder imports and macros need the desktop app. Copilot in Excel needs a Microsoft 365 plan that includes Copilot, and nothing in the course depends on it.
Is this Microsoft Office Specialist (MO-200) preparation?
No. It is a practical course for engineering work, not preparation for a Microsoft exam, and EDWartens is not affiliated with Microsoft.
Is the Excel for Engineers: Formulas, Data and Dashboards course really free?
Yes. Every module, the notes, the project and the final assessment. The only paid item is the certificate, if you want it.
What certificate does the Excel for Engineers: Formulas, Data and Dashboards course give?
An EDWartens Certificate of Completion, issued when you pass the final assessment, with a number anyone can verify on our site. It is not a Microsoft certification.
How long does the Excel for Engineers: Formulas, Data and Dashboards course take?
About 12 hours of video lessons, notes and practice, taken at your own pace; the videos alone are about 9 hours. The optional project takes about 10 hours more.
What is the project in the Excel for Engineers: Formulas, Data and Dashboards course?
You build the shift-report workbook for a packaging line: it imports a folder of daily SCADA exports with Power Query, calculates downtime, stops, MTBF, MTTR and temperature excursions, shows them on a dashboard with slicers, and refreshes and exports the report with one button. A complete sample pack shows the specification, tag list, calculation register, test record, procedure and a finished report.
What you walk away with
Your certificate for Excel for Engineers: Formulas, Data and Dashboards
Finish the course, pass the final, and this is the document with your name on it.

Verifiable by anyone
Adds to LinkedIn in one click
QR code on the certificate
Names what you can do
A permanent link
Earned, not attended
Learning is free. The certificate is optional.
Add it now and pay only when you have finished the course, or come back for it later. One-off, US$23.99, with a receipt.
Issued by EDWartens, the training division of Wartens, as a Certificate of Completion for this self-paced course. Sold by Wartens Ltd (England and Wales). It is not a vendor certification, a university award or a CPD-accredited activity, and it does not certify competence on live equipment. Delivered electronically; see the refund policy.
Credits
Who made the video lessons
The video lessons in this course were created by the people below, not by EDWartens. Every lesson streams from its creator's own YouTube channel; EDWartens neither hosts nor sells that footage, and the creators are not affiliated with EDWartens and do not endorse this course. What EDWartens wrote is the study plan, the notes, the practice tasks and the assessments.
- Kevin Stratvertthe beginner tutorial, cell references, formulas and functions, IF, COUNTIF and COUNTIFS, XLOOKUP, INDEX MATCH, PivotTables, forecasting and trendlines, Power Query, conditional formatting, interactive dashboards and creating macros
- Leila GharaniXLOOKUP, TEXTSPLIT, TEXTBEFORE and TEXTAFTER, PivotTables and date grouping, histograms, unpivot in Power Query, smart drop-down lists, custom data validation, LET, LAMBDA and a real-world macro
- excelisfun (Mike Girvin)the Excel 365 Basics lessons on number formatting and ROUND, IF and logical tests, and date and time formulas
- Chandoothe dynamic array functions lesson (FILTER, SORT, UNIQUE) and slicers for dashboards
- MyOnlineTrainingHub (Mynda Treacy)combining a folder of files with Power Query, and the three-step interactive dashboard
- EngineerExceladvanced lookups for engineering tables
- David McLachlanthe control chart with dynamic control lines
- Up4Excelfunctions for cleaning dirty dates
- Steven Bradburnadding a trendline, its equation and R squared
- Technology for Teachers and Studentseverything about Excel Tables
- Kenji Explainsthe fifteen-minute Excel essentials review before the final
- Microsoftthe short official lesson on creating and formatting tables (published on Microsoft's Copilot channel)
If you are one of these creators and would like a lesson removed or credited differently, write to info@wartens.com.