READING P&IDS
How to Read a P&ID: Tags, Bubbles and Signal Lines Explained
A P&ID looks dense until you know the order to read it in. Legend first, process line second, then the instrument tags, bubbles and signal lines, with a worked level-control loop.
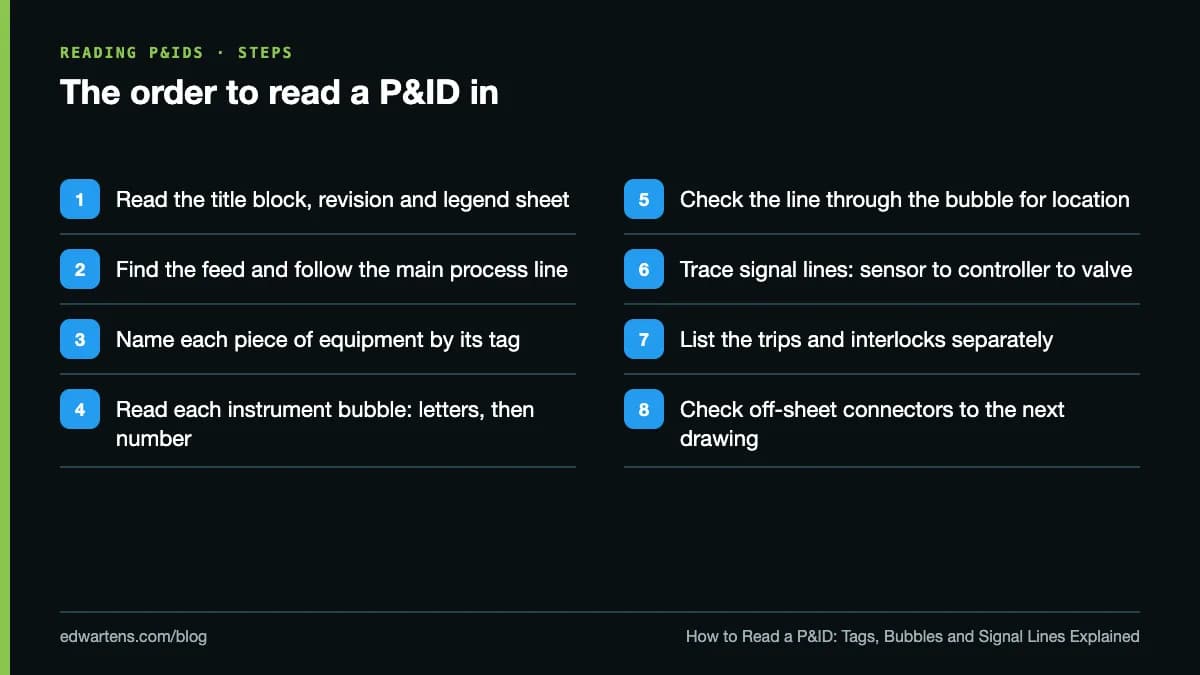
To read a P&ID, start with the legend sheet, then follow the main process line from feed to product, naming each piece of equipment as you pass it. Then read every instrument bubble: the letters say what is measured and what the device does, the number names its control loop, and the line through the bubble says where the device lives. Finally, trace the signal lines from sensor to controller to valve.
Checked 5 October 2026 against the current ISA-5.1 edition.
That order matters more than memorising symbols. A P&ID (piping and instrumentation diagram) packs the whole design of a process unit onto a few sheets, and people who find them hard to read usually start in the middle.
What is a P&ID, and what is it not?
A P&ID is a detailed diagram of a process unit showing the equipment together with the instrumentation and control devices. It shows vessels, tanks, pumps, compressors and heat exchangers; every pipe with its line number, size and flow direction; valves of every kind, including relief valves; vents and drains; and every instrument, with its tag and its signal connections.
It is not a process flow diagram (PFD). A PFD shows the main streams and design conditions so you can understand the process. The P&ID is the construction and control document built from it. It is also not a loop diagram or a wiring diagram: it tells you that LT-101 sends a signal to LIC-101, not which terminal the cable lands on. That detail lives in the loop drawings and the I/O list.
Two standards shape most P&IDs:
- ANSI/ISA-5.1 covers instrument symbols and identification. ISA published the current edition in October 2024 and renamed it Instrumentation and Control Symbols and Identification, adding new symbols and a loop diagram symbol table. The standard was first published in 1949.
- ISO 10628-2 gives graphical symbols for equipment and piping on chemical and petrochemical diagrams, and is common on European projects.
Every project then has its own legend sheet. Companies adapt the standards, and when the legend and the standard disagree, the legend is right for that drawing set.
Step 1: read the title block and the legend
Before you look at the process, check the title block: the drawing number, the unit, the revision and the date. Working from a superseded revision is a classic and expensive mistake on site. Then spend five minutes on the legend sheets. They show the valve symbols, line types, instrument bubbles and abbreviations this project uses, and how its line numbers are built.
Step 2: follow the process line
Find where the feed enters the sheet (usually on the left, often from an off-sheet connector that names the drawing it comes from) and follow the thick main process lines in the direction of the arrows. Name each piece of equipment as you pass it by its tag, such as T-101 for a tank or P-101A/B for a duty and standby pump pair. You now know what the unit does before you have read a single instrument.
Line numbers on the pipes typically combine size, service, a sequence number and the piping class, but the order varies between companies. The legend explains the format.
Step 3: decode instrument tags
An instrument tag has two parts: letters that describe the function, and a number that identifies the loop.
The first letter is the measured or initiating variable. F is flow, L is level, P is pressure, T is temperature, A is analysis. The letters after it describe what the device does: I indicates, R records, C controls, T transmits, S is a switch, V is a valve. An optional modifier can sit after the first letter (D for differential, as in PDT, a differential pressure transmitter) and a function modifier can come at the end (H for high, L for low).
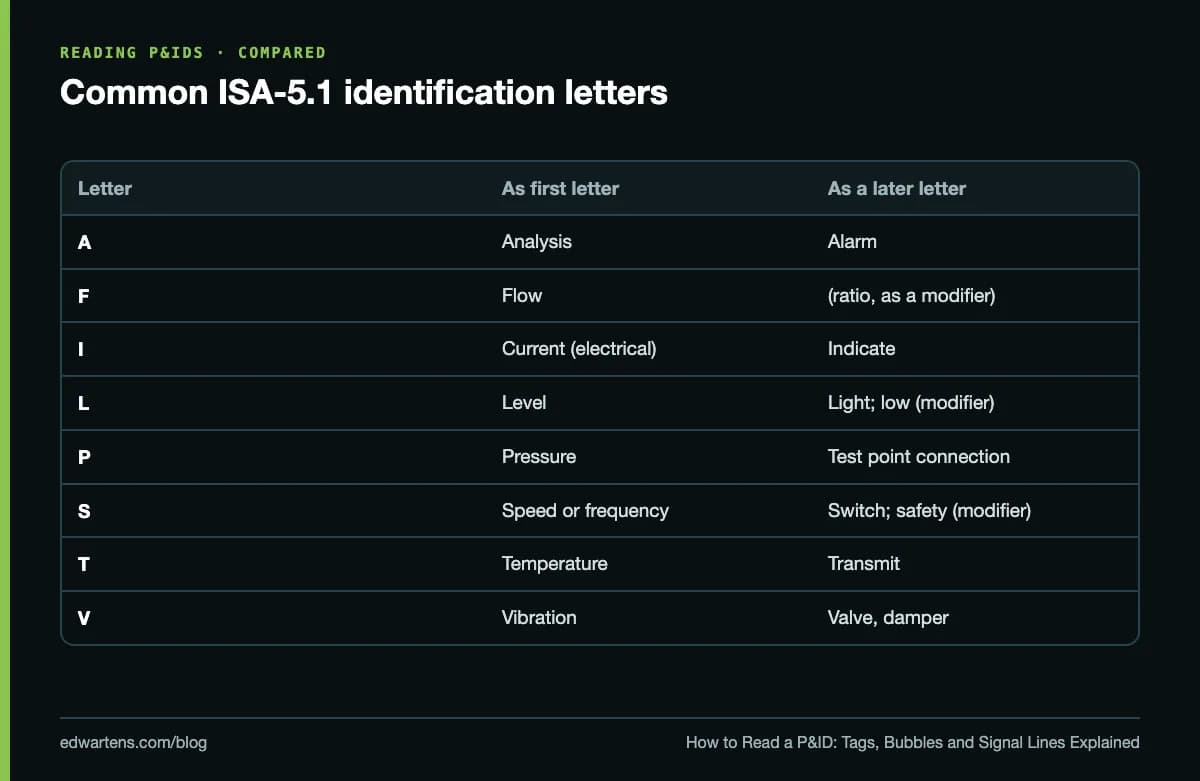
Read the letters left to right and they almost always make a phrase:
- PT-201: pressure transmitter, loop 201.
- FIC-101: flow indicating controller, loop 101.
- TE-305: temperature element (the sensor itself, such as a thermocouple or RTD).
- LSHH-102: level switch, high-high, the usual tag for a high-high level trip.
- PSV-110: pressure safety valve.
The same letter can mean different things depending on position. T as a first letter is temperature; T later in the tag is transmit. That is why TT, a temperature transmitter, is not a typo.
Loop numbers
Everything in one control loop shares a number. LT-101 measures the level, LIC-101 controls it and LV-101 acts on it. Plants number loops in one of two ways: parallel, where each variable has its own sequence (TIC-101 and PIC-101 can both exist), or serial, where one sequence runs across the plant regardless of variable. The legend or the instrument index tells you which.
Step 4: read the bubble and the line through it
The shape around the tag tells you what kind of device it is, and a horizontal line through the middle tells you where it is.
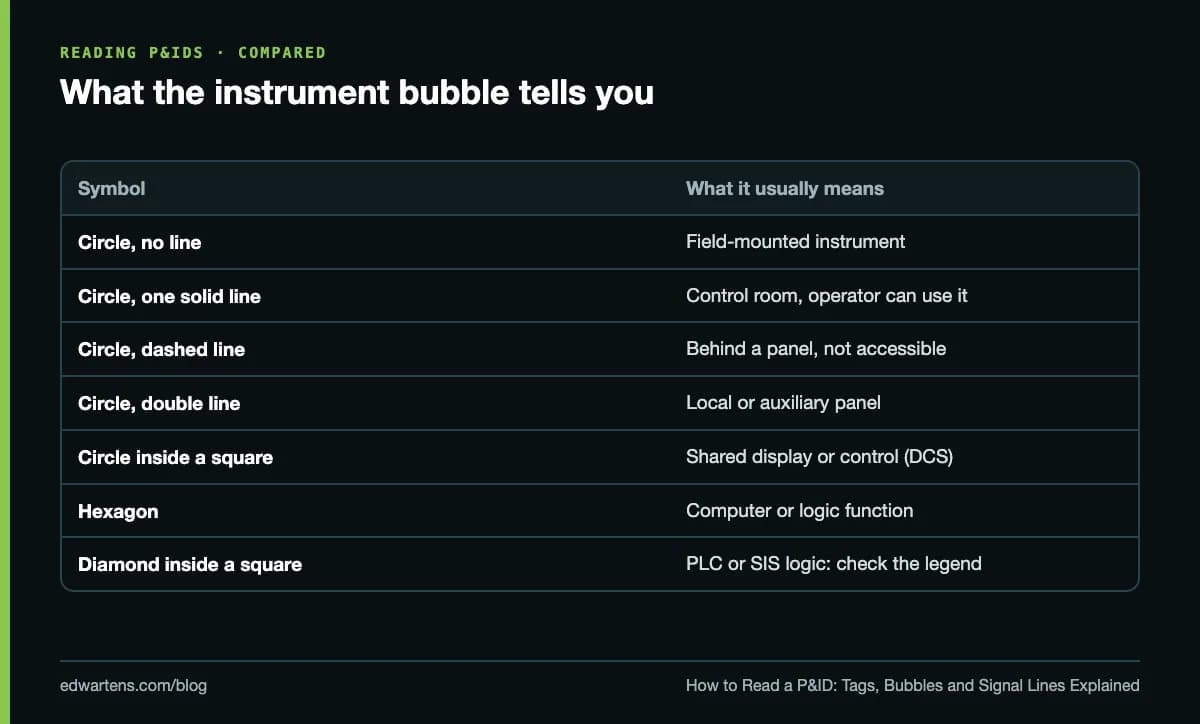
A plain circle is a discrete instrument. A circle inside a square is a function on a shared display or shared control system, which on most modern plants means the DCS or the PLC's HMI. A hexagon is a computer function. The diamond inside a square has been used for PLC logic and, in newer drawings, for safety instrumented system logic, so this is exactly where you check the legend.
The line through the bubble is about access. No line means the device is in the field. A single solid line means it is in the main control room and the operator can see or use it. A dashed line means it is in a location operators cannot normally reach, such as behind a panel. A double line means a local or auxiliary panel.
Step 5: trace the signal lines
Process piping is drawn as a heavy solid line. Instrument signals are drawn thinner and with a pattern that tells you the signal type. On ISA-style drawings an electrical signal is usually a dashed line and a pneumatic signal is a line with short double cross-hatches; software and data links have their own pattern. Patterns differ more between companies than bubbles do, so confirm them on the legend before you trust them.
A worked example: tank level control with a high-high trip
Picture a buffer tank T-101 with an inlet line from upstream and an outlet line to pump P-101. On the sheet you see:
- LT-101, a plain circle with no line, connected to the side of the tank. A field-mounted level transmitter.
- A dashed line from LT-101 to LIC-101, a circle inside a square with a single line. An electrical signal to a level indicating controller on the DCS, which the operator sees in the control room.
- A dashed line from LIC-101 to LV-101 on the outlet line. The controller opens and closes the outlet valve to hold the level at its set point.
- Separately, LSHH-102, a second level device near the top of the tank, wired to logic in a diamond-in-square bubble, which drives XV-102, an on/off valve on the inlet line. Check the legend: on this project the diamond might be the SIS.
Read as a story: level is measured, controlled by throttling the outlet, and if it ever reaches high-high, an independent device closes the inlet. That is the control loop and the protection layer, each with its own loop number and its own sensor, which is how independent layers are meant to look. If you want to know why the trip uses its own sensor, our guide to safety PLCs, SIL and SIS explains it.
How a PLC or DCS engineer uses the P&ID
For an automation engineer, the P&ID is the start of most of the paperwork:
- The I/O list. Every transmitter, switch, valve and motor on the P&ID becomes one or more I/O points. Counting them by type (analogue in, analogue out, digital in, digital out) is how panels are sized.
- Tag names. Good projects use the P&ID tag as the PLC or DCS tag, so the screen, the alarm list and the field device all say LT-101.
- Alarms and interlocks. High and low alarms, trips and permissives appear on the P&ID and are detailed in a cause-and-effect chart.
- Scaling. The P&ID or instrument datasheet gives the range of each transmitter. Our free 4-20 mA Scaling Calculator turns that range into raw PLC counts.
Common mistakes when reading P&IDs
- Ignoring the revision. Always confirm you have the current issue.
- Assuming symbols match another company's legend. Check the legend every time you join a new project.
- Reading T as temperature everywhere. Position decides meaning.
- Missing off-sheet connectors. A loop can start on one sheet and end on another.
- Treating the P&ID as a wiring diagram. It shows the connection, not the cable.
Learn it properly, free
The free Industrial Instrumentation and Process Control course has a full module on P&IDs and instrument indexes, built around videos from Instrumentation Academy and Instrumentation Tools. If you already program PLCs, Instrumentation for PLC Engineers reads the P&ID and the loop sheet from the programmer's side, and follows one measurement from the transmitter through NORM_X and SCALE_X in TIA Portal. For the control loops themselves, take PID Control for PLC Engineers, and for the protection layer, Safety Instrumented Systems and SIL to IEC 61511.
All four sit in the instrumentation and process control courses and the process control learning path. The courses are free. If you want proof, an optional EDWartens Certificate of Completion, from US$2.99, is issued after you pass the final assessment and can be checked by code at edwartens.com/verification. It is not a vendor certification and is not accredited. For background on the devices themselves, read our process instrumentation basics.
Take the free course


Questions
What is the difference between a P&ID and a PFD?
A process flow diagram (PFD) shows the main equipment, the main process streams and the design conditions, so you can see how the process works. A P&ID adds everything needed to build and control it: every pipe and valve, line numbers, vents and drains, and every instrument with its tag, location and signal connections.
What does FIC-101 mean on a P&ID?
F is the measured variable (flow), I and C are the functions (indicate and control), and 101 is the loop number. So FIC-101 is the flow indicating controller in loop 101. The transmitter in the same loop would normally be FT-101 and the control valve FV-101 (many companies write FCV-101).
Which standard defines P&ID instrument symbols?
In most of the world's process industries it is ANSI/ISA-5.1, now in its 2024 edition, titled Instrumentation and Control Symbols and Identification. Equipment and piping symbols often follow ISO 10628-2 in Europe. Every project also has its own legend sheet, and that legend wins when it differs from the standard.
Why are there two instruments with the same loop number but different letters?
Because they belong to the same control loop. A loop number groups the transmitter, the controller, the valve and any alarms that work together, and the letters tell them apart: LT-101 measures, LIC-101 controls and LV-101 acts. Some plants number loops in parallel per variable, others serially across the whole plant.
Do PLC programmers need to read P&IDs?
Yes, on any process job. The P&ID is where the I/O list, the tag names, the alarm list and most interlocks come from. A programmer who can read it can check that the code matches the design, and can talk to the process engineer in the same terms.
Sources
- ISA: ISA-5.1 standard updated (press release, 10 October 2024)
- ANSI blog: ANSI/ISA-5.1-2024 Instrumentation and Control Symbols
- Wikipedia: Piping and instrumentation diagram
- Estonian Centre for Standardisation: EN ISO 10628-2:2012 graphical symbols
- PharmaDiagrams: ISA-5.1 instrument symbols and P&ID tags
- Instrumentation Academy: Read P&ID Diagram (video used in our courses)
Written by the EDWartens engineering team for general education. Product names are trademarks of their owners; mentioning them does not imply endorsement. Prices and terms of other providers were checked on the date shown and can change.