
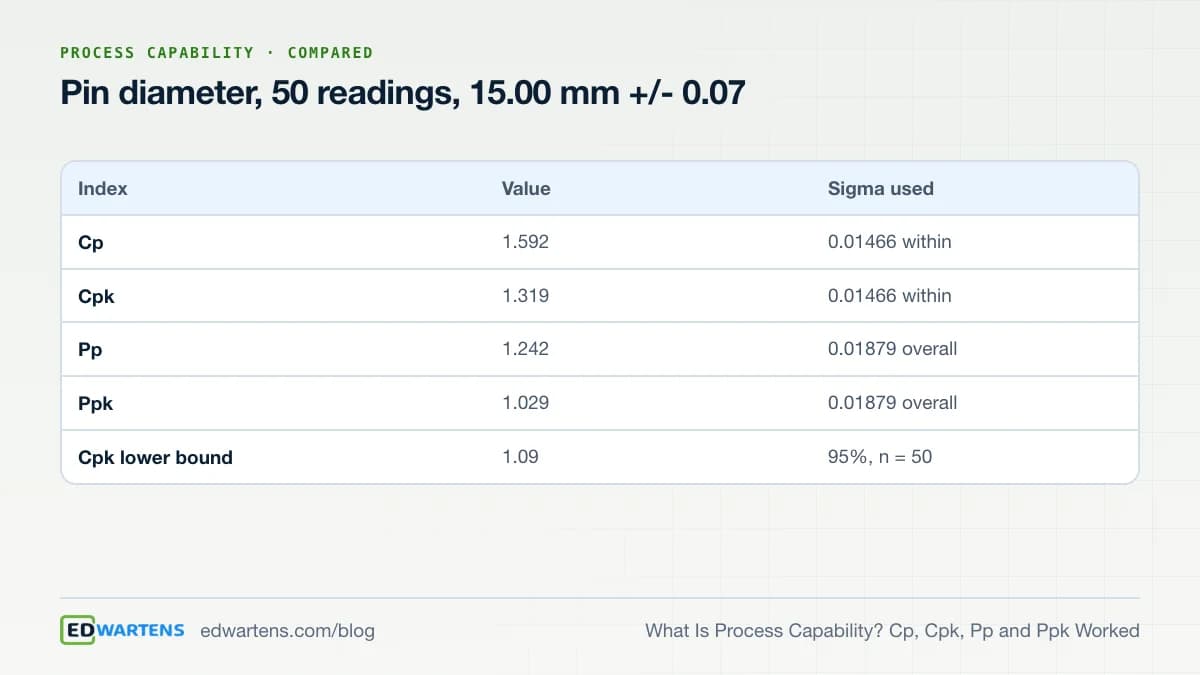
Process capability is a number that says how well a stable process fits inside its specification limits. Cp compares the width of the tolerance with six times the short-term (within-subgroup) sigma and ignores where the process is centred. Cpk adds centring by looking at the nearer limit. Pp and Ppk do the same with the long-term (overall) sigma. In the worked example below, Cp is 1.59 and Cpk is 1.32. Pp is 1.24 and Ppk is 1.03. The same 50 readings say "good", "adequate" or "marginal", depending on which index you quote.
The formulas are textbook statistics shared by the AIAG SPC manual and the NIST e-Handbook. We checked the AIAG [SPC manual page](https://www.aiag.org/training-and-resources/manuals/details/SPC-3) on 1 November 2026: it lists the second edition and says a new edition, product code SPCAV-1, was released in July 2026. This post teaches the concepts the editions share and copies no table from either. All arithmetic was run in Node and every reading is printed below.
The four indices in one table
Every index divides "room available" by "room the process uses". The difference between them is which sigma goes in the bottom line and whether the mean position counts.
| Index | Sigma used | Formula | What it tells you |
|---|---|---|---|
| Cp | Within-subgroup (short term) | (USL - LSL) / (6 x sigma within) | Could the process fit if it were centred? |
| Cpk | Within-subgroup (short term) | smaller of (USL - mean) and (mean - LSL), over 3 x sigma within | Does it fit, given where it sits? |
| Pp | Overall (long term) | (USL - LSL) / (6 x s overall) | How much room did the last run actually use, if centred? |
| Ppk | Overall (long term) | smaller of the two distances, over 3 x s overall | How much room did it use, as it ran? |
Sigma within comes from the average subgroup range divided by the constant d2 (or from the average subgroup standard deviation). Overall s is the ordinary standard deviation of every reading. When the process is stable and centred, all four indices are close. A gap between Cp and Pp means the mean wandered between subgroups. A gap between Cp and Cpk means the process is off centre.
The worked example: 50 readings of a pin diameter
A pin is specified as 15.00 mm plus or minus 0.07 mm, so LSL = 14.93 mm, USL = 15.07 mm and the tolerance is 0.140 mm. Each hour the operator measures 5 consecutive pins, for 10 hours. Subgroup size is 5, so d2 = 2.326, A2 = 0.577 and D4 = 2.114. Readings are in millimetres:
| Subgroup | Reading 1 | 2 | 3 | 4 | 5 | Mean | Range |
|---|---|---|---|---|---|---|---|
| 1 | 14.983 | 14.985 | 14.991 | 15.004 | 14.978 | 14.9882 | 0.026 |
| 2 | 15.005 | 15.006 | 15.010 | 15.048 | 15.017 | 15.0172 | 0.043 |
| 3 | 15.043 | 15.040 | 15.033 | 15.030 | 15.009 | 15.0310 | 0.034 |
| 4 | 14.996 | 14.993 | 15.019 | 15.037 | 15.009 | 15.0108 | 0.044 |
| 5 | 14.989 | 15.007 | 15.000 | 14.991 | 15.001 | 14.9976 | 0.018 |
| 6 | 15.013 | 15.011 | 15.025 | 15.037 | 15.005 | 15.0182 | 0.032 |
| 7 | 15.027 | 15.030 | 15.032 | 15.025 | 15.029 | 15.0286 | 0.007 |
| 8 | 15.005 | 15.040 | 14.997 | 15.011 | 15.025 | 15.0156 | 0.043 |
| 9 | 14.999 | 14.996 | 14.997 | 15.007 | 14.981 | 14.9960 | 0.026 |
| 10 | 15.018 | 15.020 | 15.051 | 14.983 | 15.012 | 15.0168 | 0.068 |
Step 1: check that the process is stable
An index describes a process only if it behaves predictably. Build the X-bar and R chart first.
- Average range: R-bar = 0.0341 mm. Grand mean: 15.0120 mm.
- R chart upper limit: D4 x R-bar = 2.114 x 0.0341 = 0.0721 mm. The largest range is 0.068 mm, so the ranges are in control.
- X-bar limits: 15.0120 plus or minus 0.577 x 0.0341, which is 15.0317 mm and 14.9923 mm.
- Subgroup 1 has a mean of 14.9882 mm, below the lower limit. That is a signal.
In a real plant you would stop and find the cause of subgroup 1, perhaps a cold machine at the start of the shift, before quoting any index. We carry on so you can see the arithmetic, and the numbers below are provisional.
Step 2: short-term capability, Cp and Cpk
Sigma within = R-bar / d2 = 0.0341 / 2.326 = 0.01466 mm.
- Cp = 0.140 / (6 x 0.01466) = 1.592
- CPU = (15.070 - 15.0120) / (3 x 0.01466) = 0.0580 / 0.04398 = 1.319
- CPL = (15.0120 - 14.930) / 0.04398 = 1.864
- Cpk = the smaller of 1.319 and 1.864 = 1.319
Cp says the process could fit comfortably. Cpk is lower by 0.273 because the mean sits 0.012 mm above the 15.000 target. Re-centring on 15.000 would lift Cpk to 1.592 without touching the spread.
Step 3: long-term performance, Pp and Ppk
Overall s of all 50 readings is 0.01879 mm. It is larger than 0.01466 because the subgroup means drift.
- Pp = 0.140 / (6 x 0.01879) = 1.242
- PPU = 0.0580 / (3 x 0.01879) = 1.029
- PPL = 0.0820 / 0.05637 = 1.455
- Ppk = 1.029
Turning an index into a defect rate
For a normal distribution the nearer limit sits 3 x Cpk standard deviations from the mean. Cpk 1.319 is 3.96 sigma, which leaves about 38 parts per million above the upper limit. Ppk 1.029 is 3.09 sigma, about 1,011 parts per million. The short-term index is the optimistic view of the same line. Which one is right depends on whether the drift will continue.
| Index | Sigma to the nearer limit | Parts beyond that limit |
|---|---|---|
| Cpk 1.319 | 3.96 | about 38 per million |
| Ppk 1.029 | 3.09 | about 1,011 per million |
| Ppk 1.00 | 3.00 | about 1,350 per million |
| Ppk 1.33 | 4.00 | about 32 per million |
These percentages assume a normal distribution. A skewed characteristic, such as flatness or a concentricity measure that cannot go below zero, needs a different method.
Which index should you quote?
Quote both, and say which is which. Cpk answers one question: can this process hold the limit when it behaves as well as it can? Ppk answers another: how did it do over the period we measured? For a new launch, customers usually want the long-term view once enough production has run, and the short-term view during early trials, when only a few subgroups exist. A large gap between the two, as here (1.32 against 1.03), is a finding in itself. It says the mean moves between subgroups, and the cheaper fix is to find out why, not to tighten tolerances.
Always state the sample size, how sigma was estimated and the date. A bare "Cpk 1.5" tells the reader nothing about whether it came from 25 readings or 2,500.
How many readings, and what target?
Fifty readings is a small sample. Let n be the number of readings. A rough 95 per cent lower bound on Cpk is Cpk minus 1.645 x the square root of 1 / (9n) + Cpk squared / (2 x (n - 1)). For Cpk 1.319 and n = 50 that bound is 1.09. For Ppk 1.029 it gives 0.84. So the honest statement is "Cpk is at least about 1.09 with 95 per cent confidence", not "Cpk is 1.32".
Customers often ask for a minimum index. Figures such as 1.33 for existing processes and 1.67 for new or critical characteristics are common, but they belong to the customer. Read your own requirement. A Cpk of 1.32 with a lower bound of 1.09 would not meet a 1.33 target. With one signal on the chart, the pin should not be submitted yet.
Five habits that spoil a capability study
- Quoting an index before checking the chart. An unstable process has no single sigma, so the index describes only the past.
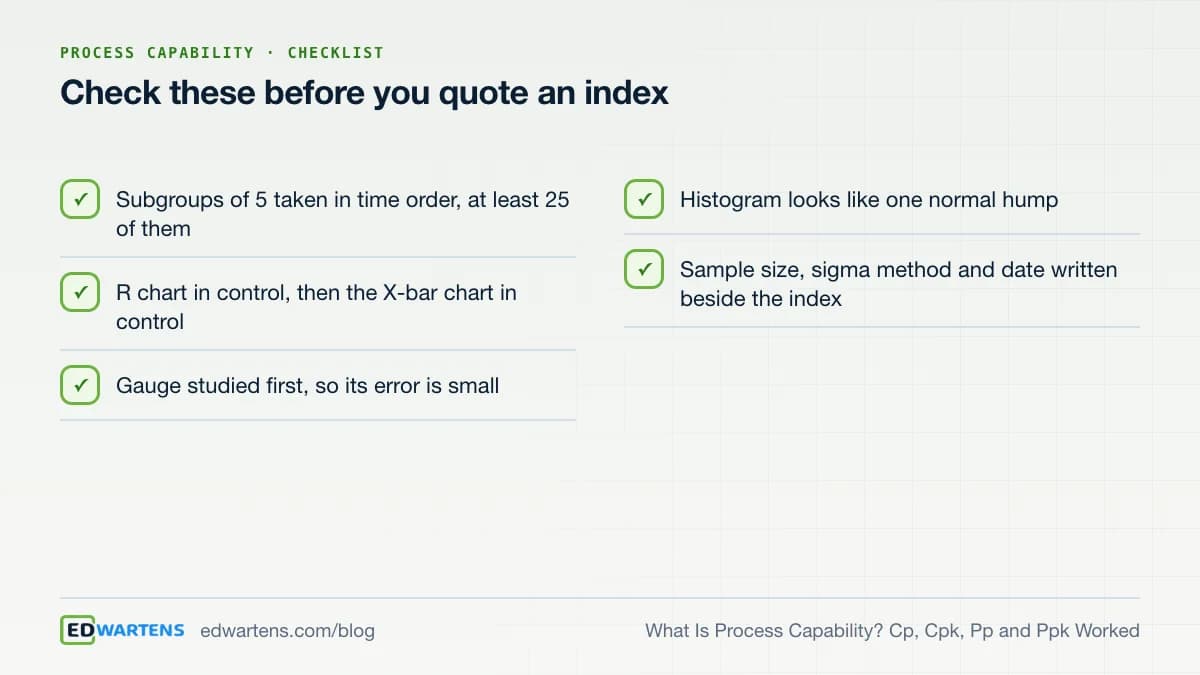
- Using a gauge that is not good enough. If measurement error is a quarter of the spread, the process looks worse than it is. Run a gauge study first.
- Mixing machines or cavities in one subgroup. That inflates sigma within and hides which source is the problem.
- Sampling too little. Twenty-five subgroups of five is a common starting point because the chart limits need that much data to settle.
- Applying normal-curve percentages to skewed data. Check a histogram or probability plot before you convert an index to parts per million.
How to repeat this in free software
Any spreadsheet will do. Enter the readings in a grid, compute the subgroup means and ranges, and use the formulas above. Excel and LibreOffice Calc both have STDEV and AVERAGE functions. JASP and R can draw the same chart and report indices. Minitab can too, but you do not need it.
Where capability fits in the larger picture
Capability is one piece of evidence in a launch package. The control plan names the characteristic. The measurement system study shows the gauge is good enough to trust. The capability study shows the process fits. The AI quality inspection guide shows what changes when cameras collect the data, and the MES overview explains where such data lives on a plant floor. For the theory behind the numbers, NIST's e-Handbook has a page on process capability and one on variables control charts.
Learn it free, with every number repeatable
The free SPC and MSA: Control Charts, Capability and Gauge R&R course builds Cp, Cpk, Pp and Ppk from first principles in modules 8 and 9. It adds confidence limits and skewed data. It then covers gauge R&R, attribute agreement and how SPC sits in APQP, PPAP and IATF 16949. Everything works in a spreadsheet.
It is a free course with a verifiable certificate of completion, and anyone can check a certificate on our verification page. EDWartens is not affiliated with AIAG, IATF or any standards body. Open the SPC and MSA course to work the same example with your own data.
Practise with us
Internships
Project work you can show
Free internships, 4 weeks each, with a free certificate. Premium is optional.
See all internshipsRoles
Quality and projects
Roles that ask for this skill, 43 open in this country now. Free to see and to apply. We are not a recruitment agency.
See rolesTake the free course
 Free
Quality management · Beginner · Free
SPC and MSA: Control Charts, Capability and Gauge R&R
 Free
Quality management · Intermediate · Free
Automotive Core Tools: FMEA (AIAG-VDA 1st Edition)
 Free
Quality management · Intermediate · Free
Six Sigma Green Belt Training for Manufacturing
 Free
Manufacturing excellence · Beginner · Free
Lean Manufacturing, OEE and TPM
Questions
What is process capability?
Process capability measures how well the natural spread of a stable process fits inside its specification limits. Cp compares the tolerance with six sigma of short-term variation, while Cpk also accounts for how far the mean sits from the nearer limit.
What is the difference between Cpk and Ppk?
Cpk uses the short-term sigma estimated within subgroups, while Ppk uses the overall standard deviation of all readings. Ppk is lower when the mean drifts between subgroups. In the worked example Cpk is 1.32 and Ppk is 1.03.
What is a good Cpk value?
There is no universal pass mark. Customers often ask for 1.33 on existing processes and 1.67 on new or critical characteristics, but the figure is theirs to set. A Cpk of 1.00 puts the nearer limit only three sigma from the mean.
How do you calculate Cpk by hand?
Estimate sigma within as the average subgroup range divided by d2, then take the smaller of (USL - mean) and (mean - LSL) and divide by three times that sigma. For subgroups of 5, d2 is 2.326.
Why can Cp be high while Cpk is low?
Cp ignores centring. A narrow process sitting close to one limit has a high Cp and a low Cpk. Moving the mean to the target raises Cpk up to the value of Cp without reducing variation.
Can I calculate capability from a small sample?
You can, but the estimate is uncertain. With 50 readings and a Cpk of 1.32 the rough 95 per cent lower bound is about 1.09. State the sample size next to every index and collect more data before a formal submission.
Sources
- AIAG: SPC manual page, second edition and the July 2026 edition (read 1 November 2026)
- NIST e-Handbook of Statistical Methods: What is process capability? (read 1 November 2026)
- NIST e-Handbook: What are variables control charts? (read 1 November 2026)
- JASP: free statistics program (read 1 November 2026)
Written by the EDWartens engineering team for general education. Product names are trademarks of their owners; mentioning them does not imply endorsement. Prices and terms of other providers were checked on the date shown and can change.

IATF 16949 Internal Audit Process: Step by Step

PPAP Levels Explained: What Is a Level 1 PPAP?

Six Sigma Black Belt Body of Knowledge, Explained

QA vs QC in Construction: Who Checks What on Site

ETABS to SAFE: Export a Floor and Check the Foundation

What Is IEC 62443? Plain-English Guide for Engineers